2023年9月6日 星期三

![gh](https://raw.githubusercontent.com/tewei0328/picture-bed/main/2023/image.png) ```python data1 = tw_close.GetClose()[(tickLengh-leftLength-showLength):(tickLengh-leftLength)] data2 = tw_close.GetSMA(signal_SMA_Length)[(tickLengh-leftLength-showLength):(tickLengh-leftLength)] data3 = tw_close.GetMAX(signal_MAX_Length)[(tickLengh-leftLength-showLength):(tickLengh-leftLength)] #data3 data4 = tw_close.GetMIN(signal_MIN_Length)[(tickLengh-leftLength-showLength):(tickLengh-leftLength)] #data3 #signal = data1 >= data2 signal = tw_close.GetSignal()[(tickLengh-leftLength-showLength):(tickLengh-leftLength)] print("Show Tick總數: ", len(data1)) sym = 't' curve1 = p1.plot(data1) curve2 = p1.plot(data2, pen='r') curve3 = p1.plot(data3, pen='b')  #data3 curve4 = p1.plot(data4, pen='g')  #data3 curve5 = p2.plot(signal, pen =(0, 0, 200), symbolBrush =(0, 0, 200), symbolPen ='w', symbol ='t1', symbolSize = 14) #-------------------------------------------------------     if liveVer == 0:     ptr1 = tickLengh-leftLength+1 #History ver:為了取得顯示在Tick圖上的Tick之後的下一個Tick else:     ptr1=-1 # Live ver.:-1 #-------------------------------------------------------     def update1():     global data1, data2, data3, data4, signal, ptr1 #data3     data1[:-1] = data1[1:]  # 即資料左移                             #[:-1]意思是->取全部,除了最後一個 (即左移, 空出最後一個值)                             #[1:]意思是->取全部,除了第一個                             #[-1]意思是->取最後一個     data1[-1] = tw_close.GetClose()[ptr1]  #最近Tick值     data2[:-1] = data2[1:]  # 即資料左移     data2[-1] = tw_close.GetSMA(signal_SMA_Length)[ptr1]     data3[:-1] = data3[1:]  # 即資料左移 #data3     data3[-1] = tw_close.GetMAX(signal_MAX_Length)[ptr1] #data3     data4[:-1] = data4[1:]  # 即資料左移 #data3     data4[-1] = tw_close.GetMIN(signal_MIN_Length)[ptr1] #data3     signal[:-1] = signal[1:]  # shift data in the array one sample left     #--- 產生黃金交叉信號     #signal[-1] = (data1[-1] >= data2[-1]) and (data1[-2] < data2[-2])     #signal[-1] = (data1[-1] >= data2[-1])     signal[-1] = tw_close.GetSignal()[ptr1]     curve1.setData(data1)     curve2.setData(data2)     curve3.setData(data3) #data3     curve4.setData(data4) #data3     curve5.setData(signal) #data3     #-------------------------------------------------------         if liveVer == 0:         ptr1 += 1  #(history ver.: 執行)         #ptr1 += 1  #(live ver.: 不執行)         #print("ptr1=", ptr1) # update all plots def update():     update1()     #update2()     #update3() ```

google sheet-appscript-vba-1分K整理

/** @OnlyCurrentDoc */ function myFunction() {   var spreadsheet = SpreadsheetApp.getActive();   spreadsheet.getRange('F:G').activate();   spreadsheet.getActiveSheet().deleteColumns(spreadsheet.getActiveRange().getColumn(), spreadsheet.getActiveRange().getNumColumns());   spreadsheet.getRange('G:P').activate();   spreadsheet.setCurrentCell(spreadsheet.getRange('I1'));   spreadsheet.getActiveSheet().deleteColumns(spreadsheet.getActiveRange().getColumn(), spreadsheet.getActiveRange().getNumColumns());   spreadsheet.getRange('A1').activate();   spreadsheet.getCurrentCell().setValue('date');   spreadsheet.getRange('B1').activate();   spreadsheet.getCurrentCell().setValue('open');   spreadsheet.getRange('C1').activate();   spreadsheet.getCurrentCell().setValue('high');   spreadsheet.getRange('D1').activate();   spreadsheet.getCurrentCell().setValue('low');   spreadsheet.getRange('E1').activate();   spreadsheet.getCurrentCell().setValue('close');   spreadsheet.getRange('F1').activate();   spreadsheet.getCurrentCell().setValue('volume');   spreadsheet.getRange('F2').activate(); };

2023年9月5日 星期二

【Python交易程式開發現場59】*產生交易訊號 (17) | 將交易訊號送至下單函數 | 交易訊號下單在OnNotify()

# 【交易程式架構】 1. 視窗物件區,view鈕,槽函數 【V】 2. (tw函數1) 呼叫API函數區,tw呼叫類函數(連線,查報價,下單,查倉位)【III.1】 3. (tw函數2) API事件回傳用,tw回傳處理類函數(顯示回傳訊息,存Tick值,畫Tick圖,計算指標,產生訊號,自動下單)【III.2】 4. API事件回傳區 5. 外部py函數檔(將.py整個檔視為一個副程式, 用import .py載入, 如: 畫Tick圖) --- I. Qt 自訂Signal/Slot 類別 II - 群益API物件 & 公用變數 & 工具函數 III. 群益API 事件所對應之相關tw函數 (於V.槽函數所會用到的子工具函數區) IV - 群益API事件 V - View | 主視窗類別 | 按鈕送出訊號所對應之槽函數 ![[Pasted image 20230905115301.png]] ![[Pasted image 20230905125605.png]] ![gh](https://raw.githubusercontent.com/tewei0328/picture-bed/main/2023/1693898435000jframr.png) twGlobal.py ![gh](https://raw.githubusercontent.com/tewei0328/picture-bed/main/2023/1693898899000b7n4fx.png) twIndicator.py ![gh](https://raw.githubusercontent.com/tewei0328/picture-bed/main/2023/1693924139000c06cv7.png) ![gh](https://raw.githubusercontent.com/tewei0328/picture-bed/main/2023/1693924178000un1lce.png)

test

markdown #test

2023年9月4日 星期一

【Python交易程式開發現場41】*產生交易訊號 (4) | 用pyqtgraph畫動態均線圖 (twMASignal.py)


import matplotlib as mpl
import matplotlib.pyplot as plt
from time import perf_counter
import numpy as np
import pyqtgraph as pg
import pickle

from twIndicator import twClosePriceModel
import twGlobal
tw_close = twGlobal.twClose             #Ticks報價
tw_kbar1m = twGlobal.twKBar1M

with open('twclose.pickle', 'rb') as f:
    tw_close = pickle.load(f)           #Ticks報價


win = pg.GraphicsLayoutWidget(show=True)
win.setWindowTitle('pyqtgraph example: Scrolling Plots')

p1 = win.addPlot()


showLength = 100   # Tick圖總長度
leftLength = 500   # 動態看最後leftLength筆Ticks
tickLengh = len(tw_close.GetClose())  #取得之所有Tick數目
print("Tick總數: ", tickLengh)

# data1為顯示在Tick圖上之所有data
data1 = tw_close.GetClose()[(tickLengh-leftLength-showLength):(tickLengh-leftLength)]
data2 = tw_close.GetSMA()[(tickLengh-leftLength-showLength):(tickLengh-leftLength)]
print("Show Tick總數: ", len(data1))


curve1 = p1.plot(data1)
curve2 = p1.plot(data2)

ptr1 = tickLengh-leftLength+1 #為了取得顯示在Tick圖上的Tick之後的下一個Tick


def update1():
    global data1, data2, ptr1
    data1[:-1] = data1[1:]  # shift data in the array one sample left
                            #[:-1]意思是->取全部,除了最後一個
                            #[1:]意思是->取全部,除了第一個
                            #[-1]意思是->取最後一個
                            # (see also: np.roll)
    #data1[-1] = np.random.normal()
    data1[-1] = tw_close.GetClose()[ptr1]
    curve1.setData(data1)

    data2[:-1] = data2[1:]  # shift data in the array one sample left
    data2[-1] = tw_close.GetSMA()[ptr1]
    curve2.setData(data2)
    ptr1 += 1
    print("ptr1=", ptr1)


# update all plots
def update():
    update1()


timer = pg.QtCore.QTimer()
timer.timeout.connect(update)
timer.start(50)


if __name__ == '__main__':
    pg.exec()


【Python交易程式開發現場20】*畫1分K線(6) | numpy array, tuple的轉換問題 | 時間軸必須為數字的解決 | twCandleStick.py

1. numpy array, tuple的轉換問題 


Python中的list与NumPy中array的区别 及相互转换


python-基础语法-list、array、set、tuple转换


>>> a=numpy.array([[1,2,3],[4,5,6]])
>>> a
array([[1, 2, 3],
       [4, 5, 6]])

>>> tuple(a.reshape(1, -1)[0])
(1, 2, 3, 4, 5, 6)


class CandlestickItem(pg.GraphicsObject):
    def __init__(self, data):
        pg.GraphicsObject.__init__(self)
        self.data = data  ## data must have fields: time, open, close, min, max
        self.generatePicture()
   
    def generatePicture(self):
        ## pre-computing a QPicture object allows paint() to run much more quickly,
        ## rather than re-drawing the shapes every time.
        self.picture = QtGui.QPicture()
        p = QtGui.QPainter(self.picture)
        p.setPen(pg.mkPen('w'))
        #w = (self.data[1][0] - self.data[0][0]) / 3.
        w = 0.333
        for (t, open, close, min, max) in self.data:
            p.drawLine(QtCore.QPointF(t, min), QtCore.QPointF(t, max))
            if open > close:
                p.setBrush(pg.mkBrush('r'))
            else:
                p.setBrush(pg.mkBrush('g'))
            p.drawRect(QtCore.QRectF(t-w, open, w*2, close-open))
        p.end()


出現錯誤-> 發現程式中的時間 t必須為數字1, 2, 3, ...才能正常運作, 
所以使用range()來產生數字1,2,3,...


說明:range() 函數的回傳資料型態為 range,無法使用 print() 列印出其值,實務上會使用list() 函數將其轉換成串列(list)型態的資料

(1) range(n):表示產生 0 至 n-1 的數列

範例:產生0至10的數列

           >>> a=range(11)
           >>> type(a)
           <class 'range'>     #由range函數產生的資料型態為range
           >>> a=list(a)         #使用list()函數來轉換成串列型態
           >>> print(a)

           執行結果:[0, 1, 2, 3, 4, 5, 6, 7, 8, 9, 10]

(2) range(start,end):start為起始值,end為終止值,產生 start 至 end-1 的數列

範例:產生1至10的數列

           >>> a=list(range(1,11))
           >>> print(a)

          執行結果:[1, 2, 3, 4, 5, 6, 7, 8, 9, 10]


## fields are (time, open, close, min, max).
N=50
#data_time_range = list(range(1,N+1))
data_time = list(tw_kbar1m.GetTime()[2:N])
data_time1=[i.strftime("%M:%S") for i in data_time]
data_time2 = tuple(data_time1)
data_time3 = tuple(range(3,N+1))

data_open = tuple(tw_kbar1m.GetOpen()[2:N])
data_close = tuple(tw_kbar1m.GetClose()[2:N])
data_low = tuple(tw_kbar1m.GetLow()[2:N])
data_high = tuple(tw_kbar1m.GetHigh()[2:N])

data1=[data_time3,data_open,data_close,data_low,data_high]
data2=list(zip(data_time3,data_open,data_close,data_low,data_high))


## fields are (time, open, close, min, max).
N1=300
N=600
#data_time_range = list(range(1,N+1))
data_time = list(tw_kbar1m.GetTime()[N1:N])
data_time1=[i.strftime("%M:%S") for i in data_time]
data_time2 = tuple(data_time1)
data_time3 = tuple(range(N1+1,N+1))

data_open = tuple(tw_kbar1m.GetOpen()[N1:N])
data_close = tuple(tw_kbar1m.GetClose()[N1:N])
data_low = tuple(tw_kbar1m.GetLow()[N1:N])
data_high = tuple(tw_kbar1m.GetHigh()[N1:N])

data1=[data_time3,data_open,data_close,data_low,data_high]
data2=list(zip(data_time3,data_open,data_close,data_low,data_high))


2023年8月4日 星期五

vscode-debug-jupyter notebook


https://pythonviz.com/colab-jupyter/visual-studio-code-jupyter-notebook-integration/


第 4 步:匯出至 Python 檔案或 HTML 檔案

完成 Jupyter Notebook 編程後,自然地我們會有 2 個選擇:

  1. 把 Jupyter Notebook 匯出成 PDF 或 HTML 檔案,儲存為報告
  2. 把編程結果匯出成 .py 檔案,讓我們可以使用 Terminal 運作代碼


2023年8月3日 星期四

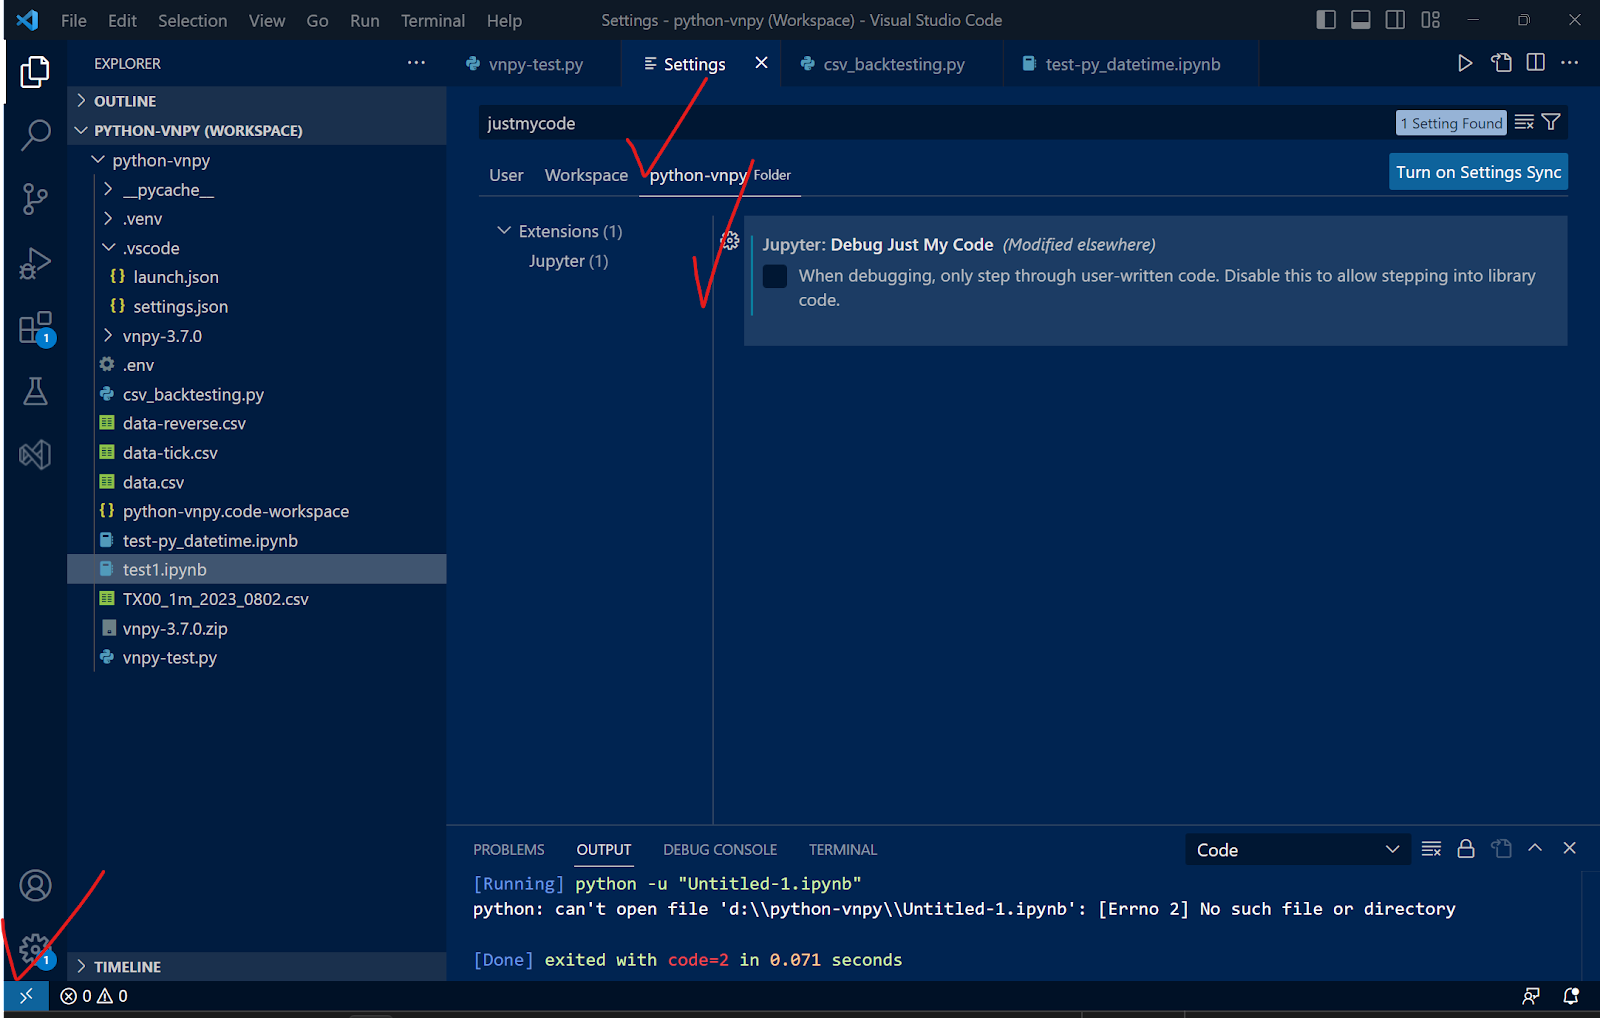
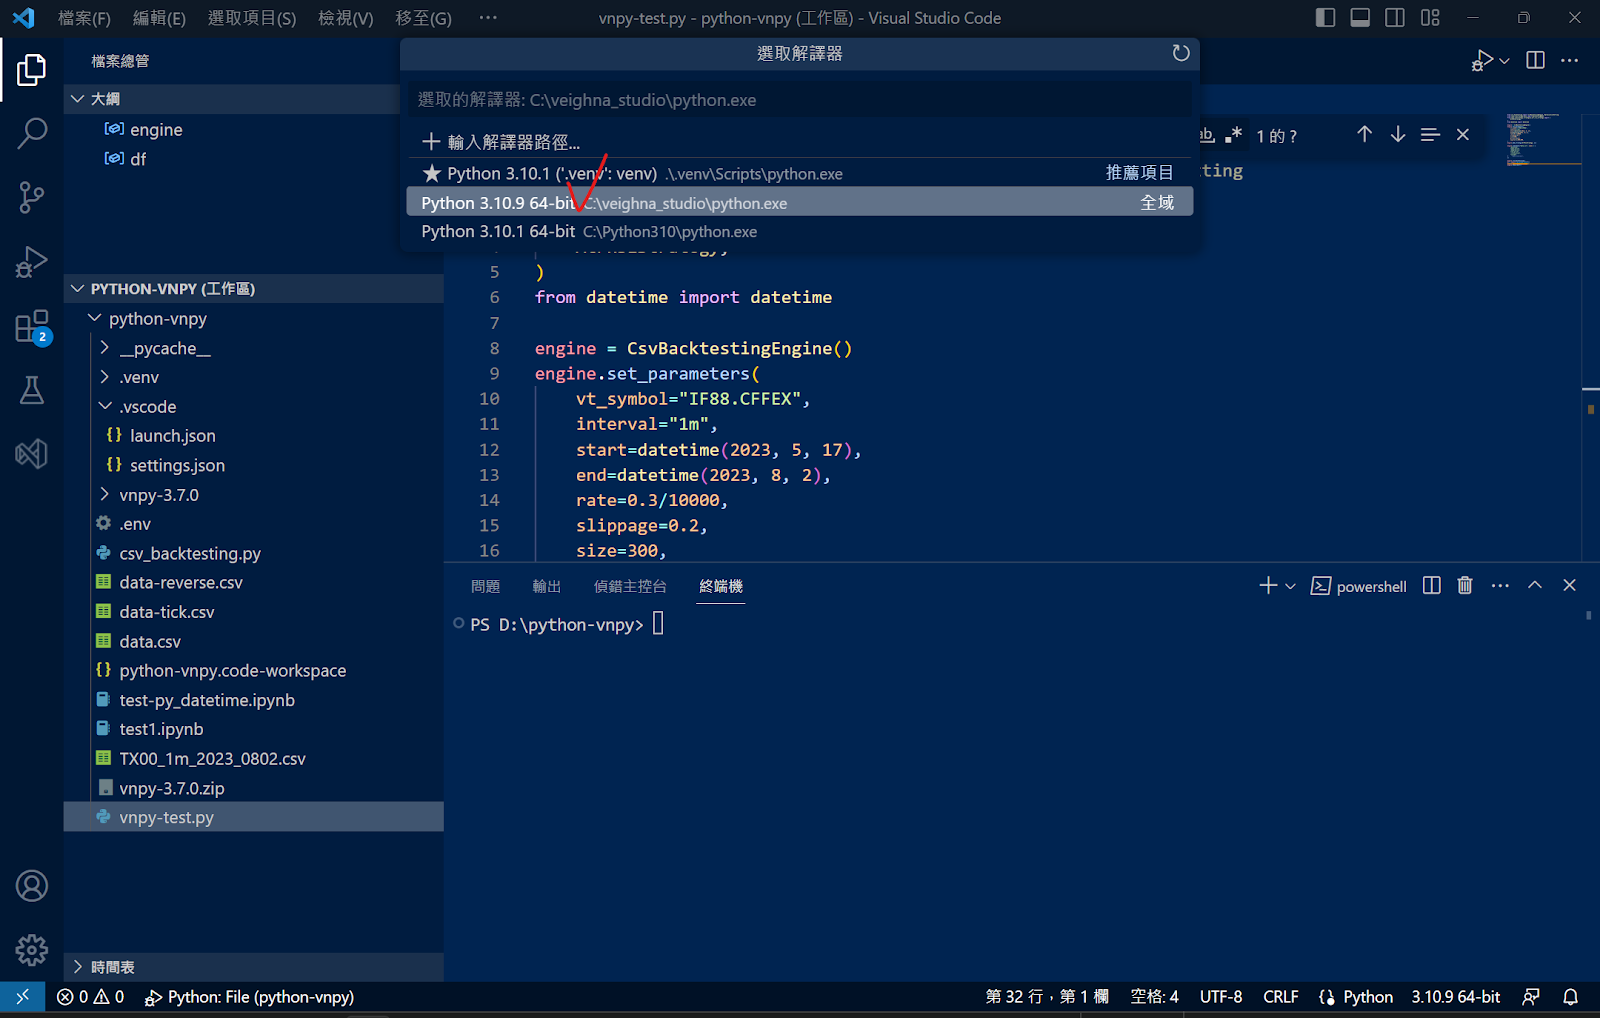
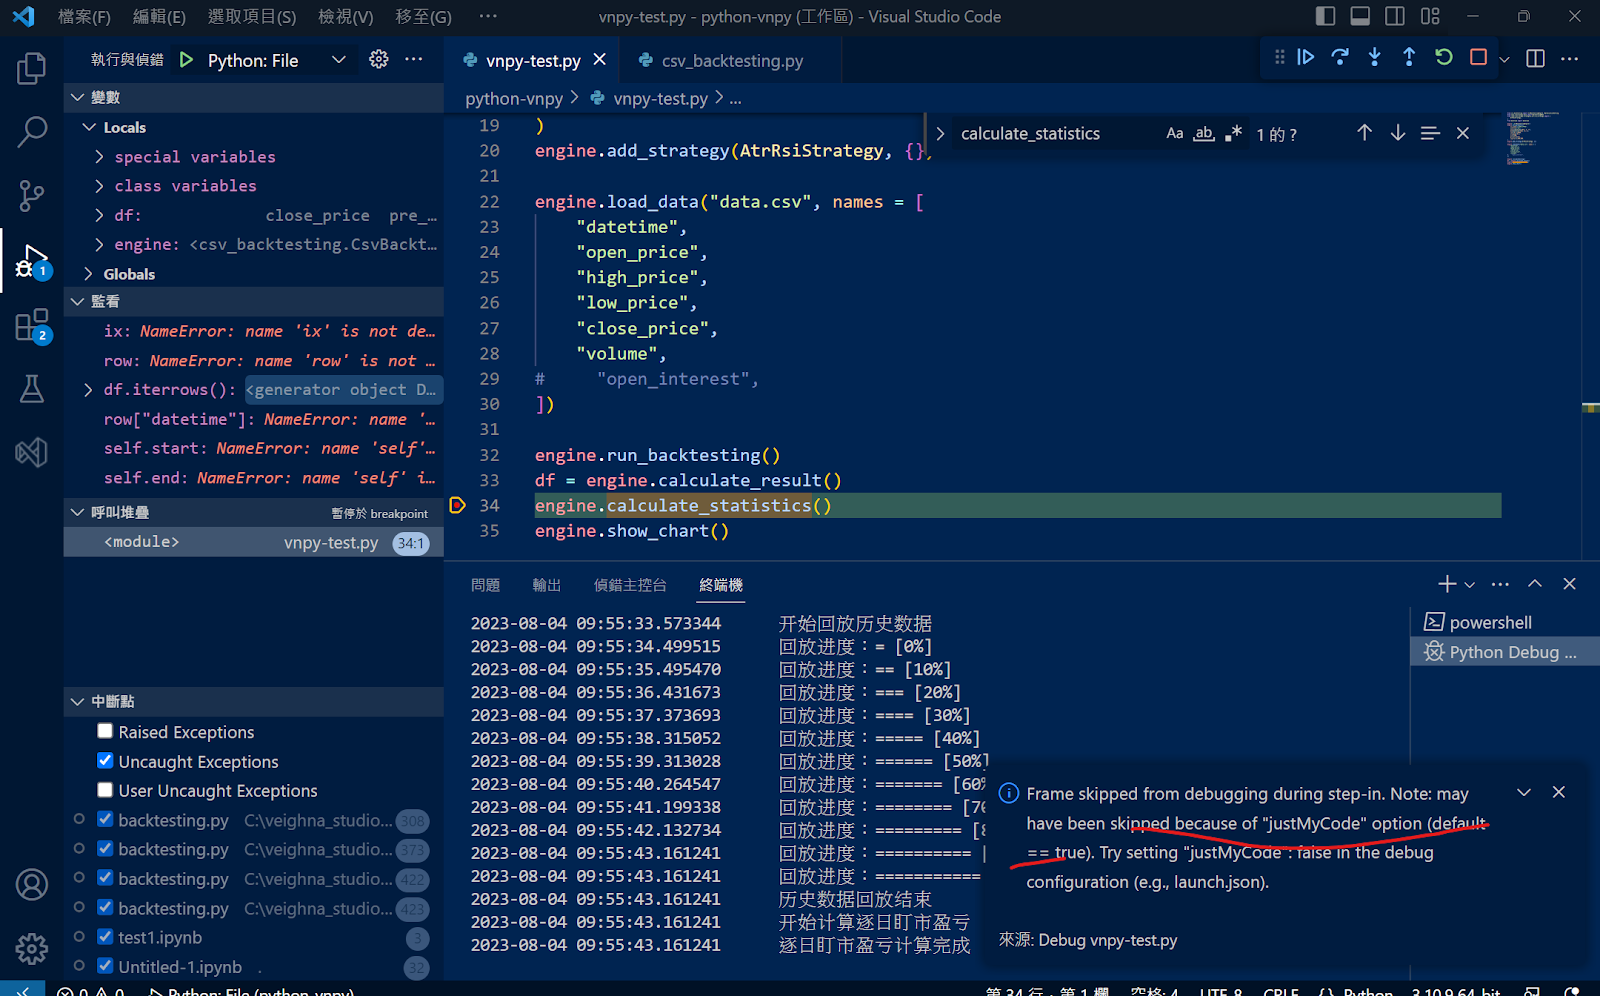
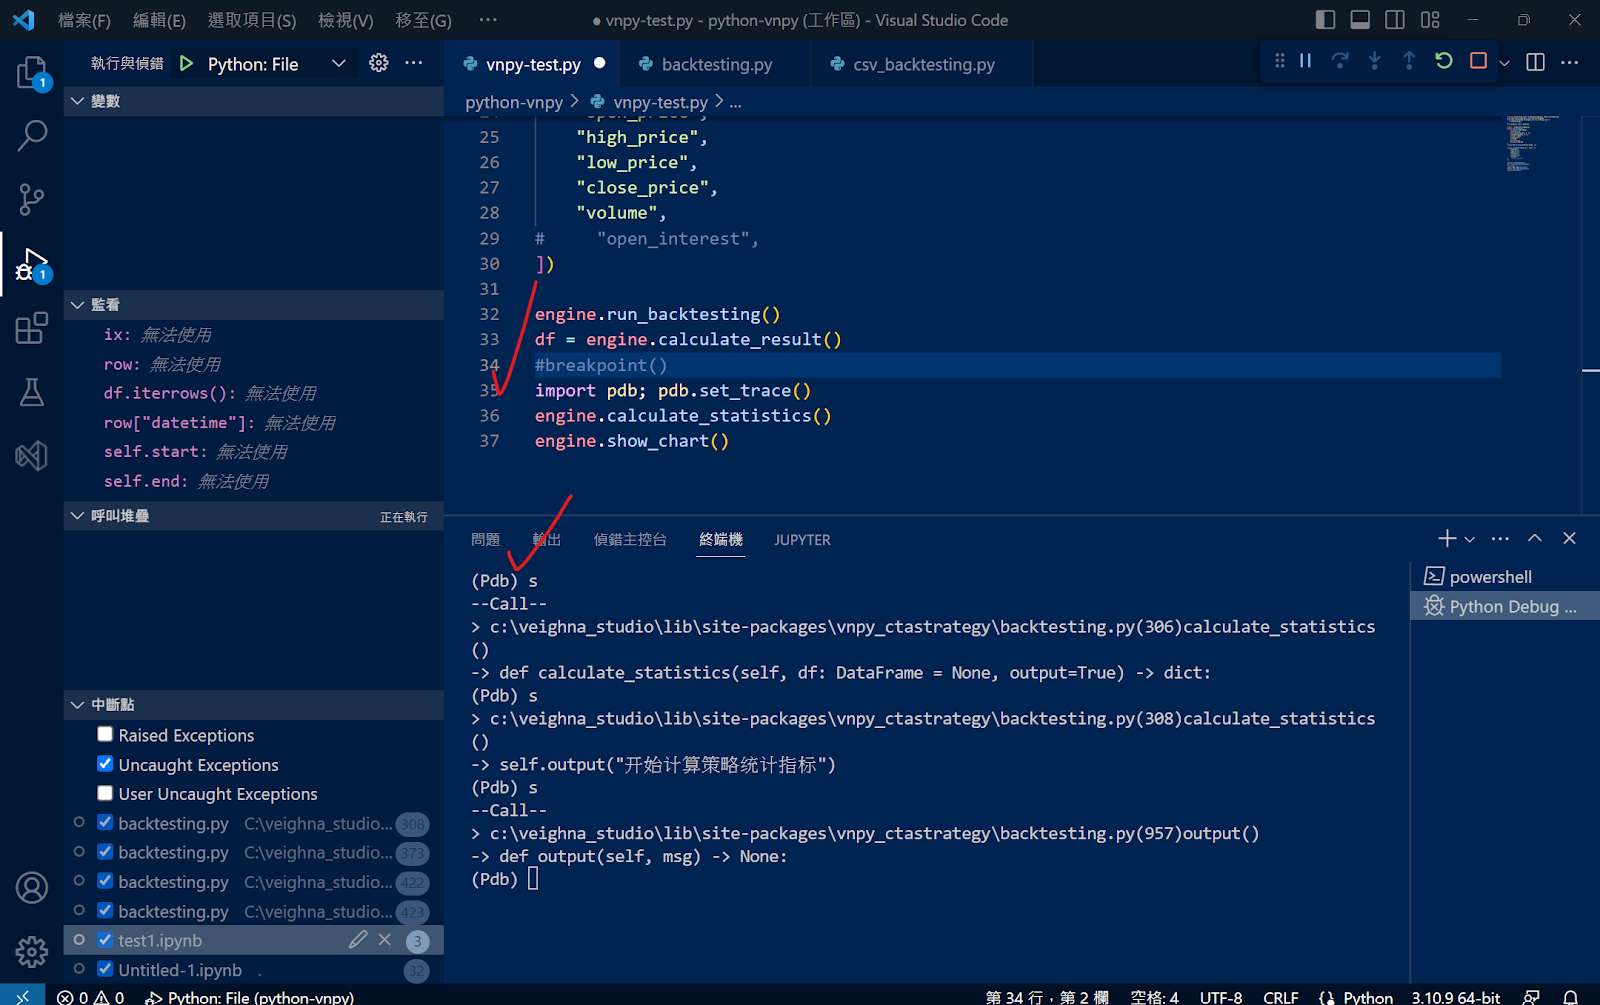
vs-code-debug (pdb能順利trace進入外部程式模組..)(找到了VS Code debug外部程式的關鍵: justmycode=false+purpose: ["debug-in-terminal"])

 結論: 最後, 發現真正管用的是PDB..

1. pdb能順利trace進入外部程式模組..

2. pdb.run("print(df)")

3. 還是找到了VS Code debug外部程式的關鍵: 真的是在justmycode=false後面加上purpose: ["debug-in-terminal"]就OK了

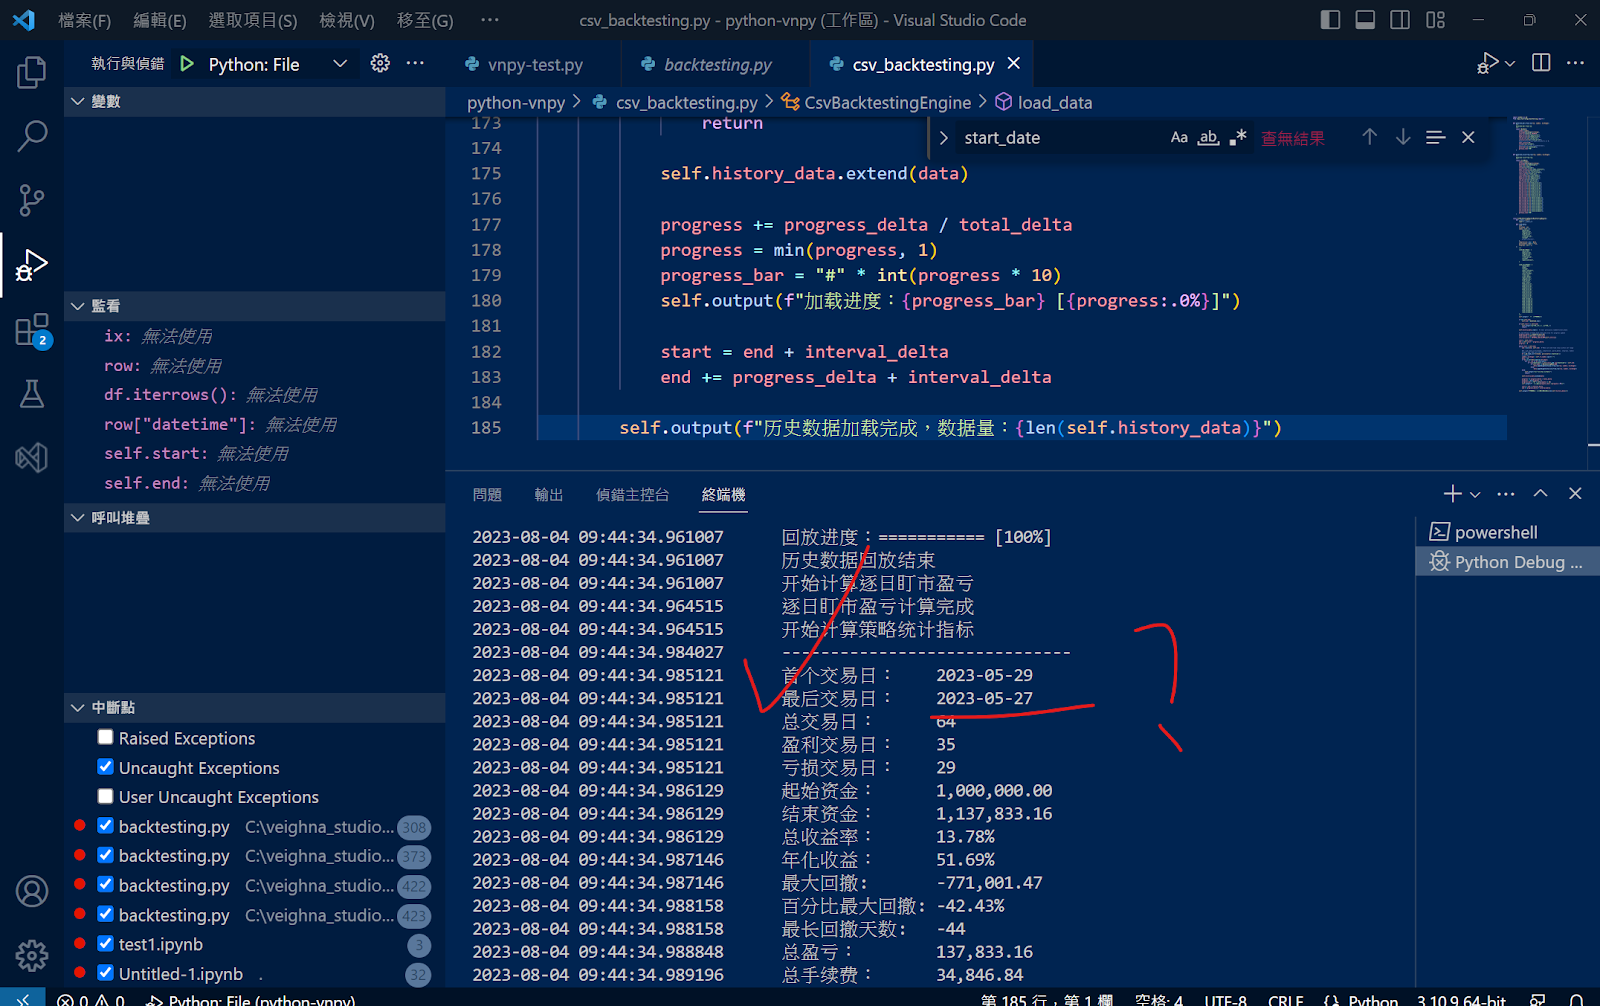
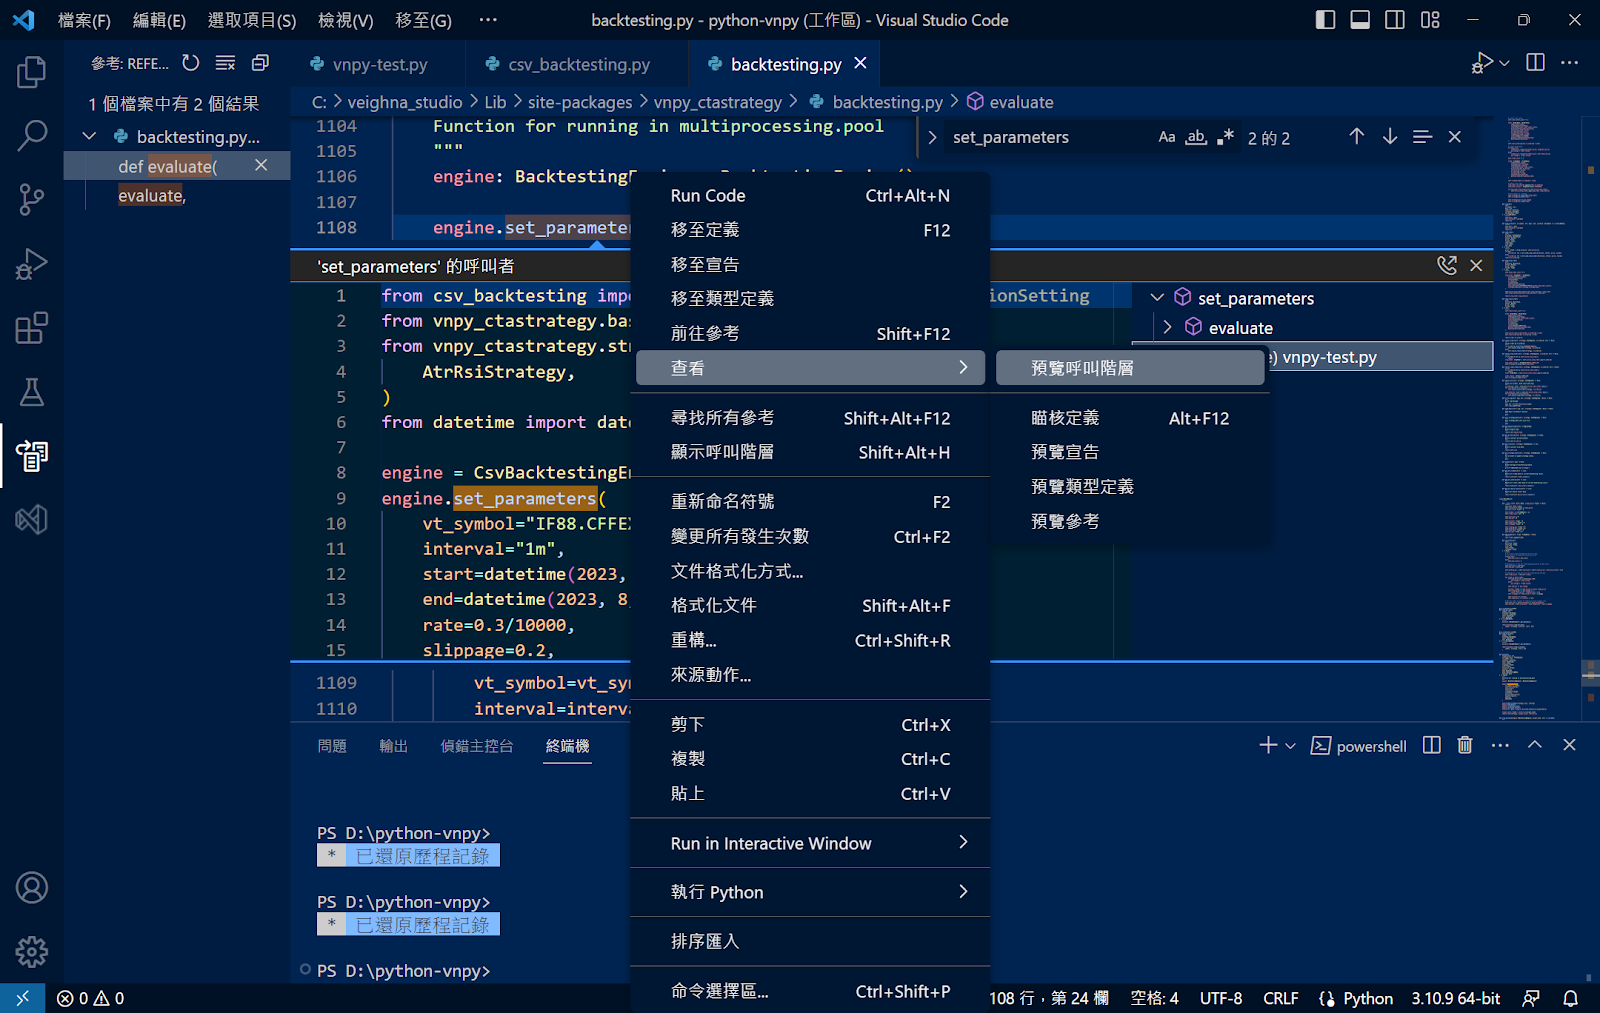
4. 不錯的debug功能: 預覽呼叫階層(可以反查某函數被誰呼叫)


https://blog.csdn.net/Edward__J/article/details/129804740?utm_medium=distribute.wap_relevant.none-task-blog-2~default~baidujs_baidulandingword~default-1-129804740-blog-111991099.237&fbclid=IwAR1_J5RbBaO4iZEGaitTVtWXtW1RvtbfFstK2waBugQG8taZZg2m_Smw6pk

[关于vscode调试时跳不到本.py或本.ipynb文件之外的问题_vscode打不开ipynb_Jay E的博客-CSDN博客](https://blog.csdn.net/Edward__J/article/details/129804740?utm_medium=distribute.wap_relevant.none-task-blog-2~default~baidujs_baidulandingword~default-1-129804740-blog-111991099.237&fbclid=IwAR1_J5RbBaO4iZEGaitTVtWXtW1RvtbfFstK2waBugQG8taZZg2m_Smw6pk) [[Obsidian-Highlights]]


問題:
2023-08-04 09:44:34.985121      首个交易日:    2023-05-29
2023-08-04 09:44:34.985121      最后交易日:    2023-05-27
2023-08-04 09:44:34.985121      总交易日:      64
2023-08-04 09:44:34.985121      盈利交易日:    35
2023-08-04 09:44:34.985121      亏损交易日:    29


最後, 發現真正管用的是PDB..


pdb.run("print(df)")


找到問題的源頭了, df資料是錯的..看時間就知了..


df, 和data.csv不同, 差很多, 不知是否與其內部原有的sqlite相衝突?


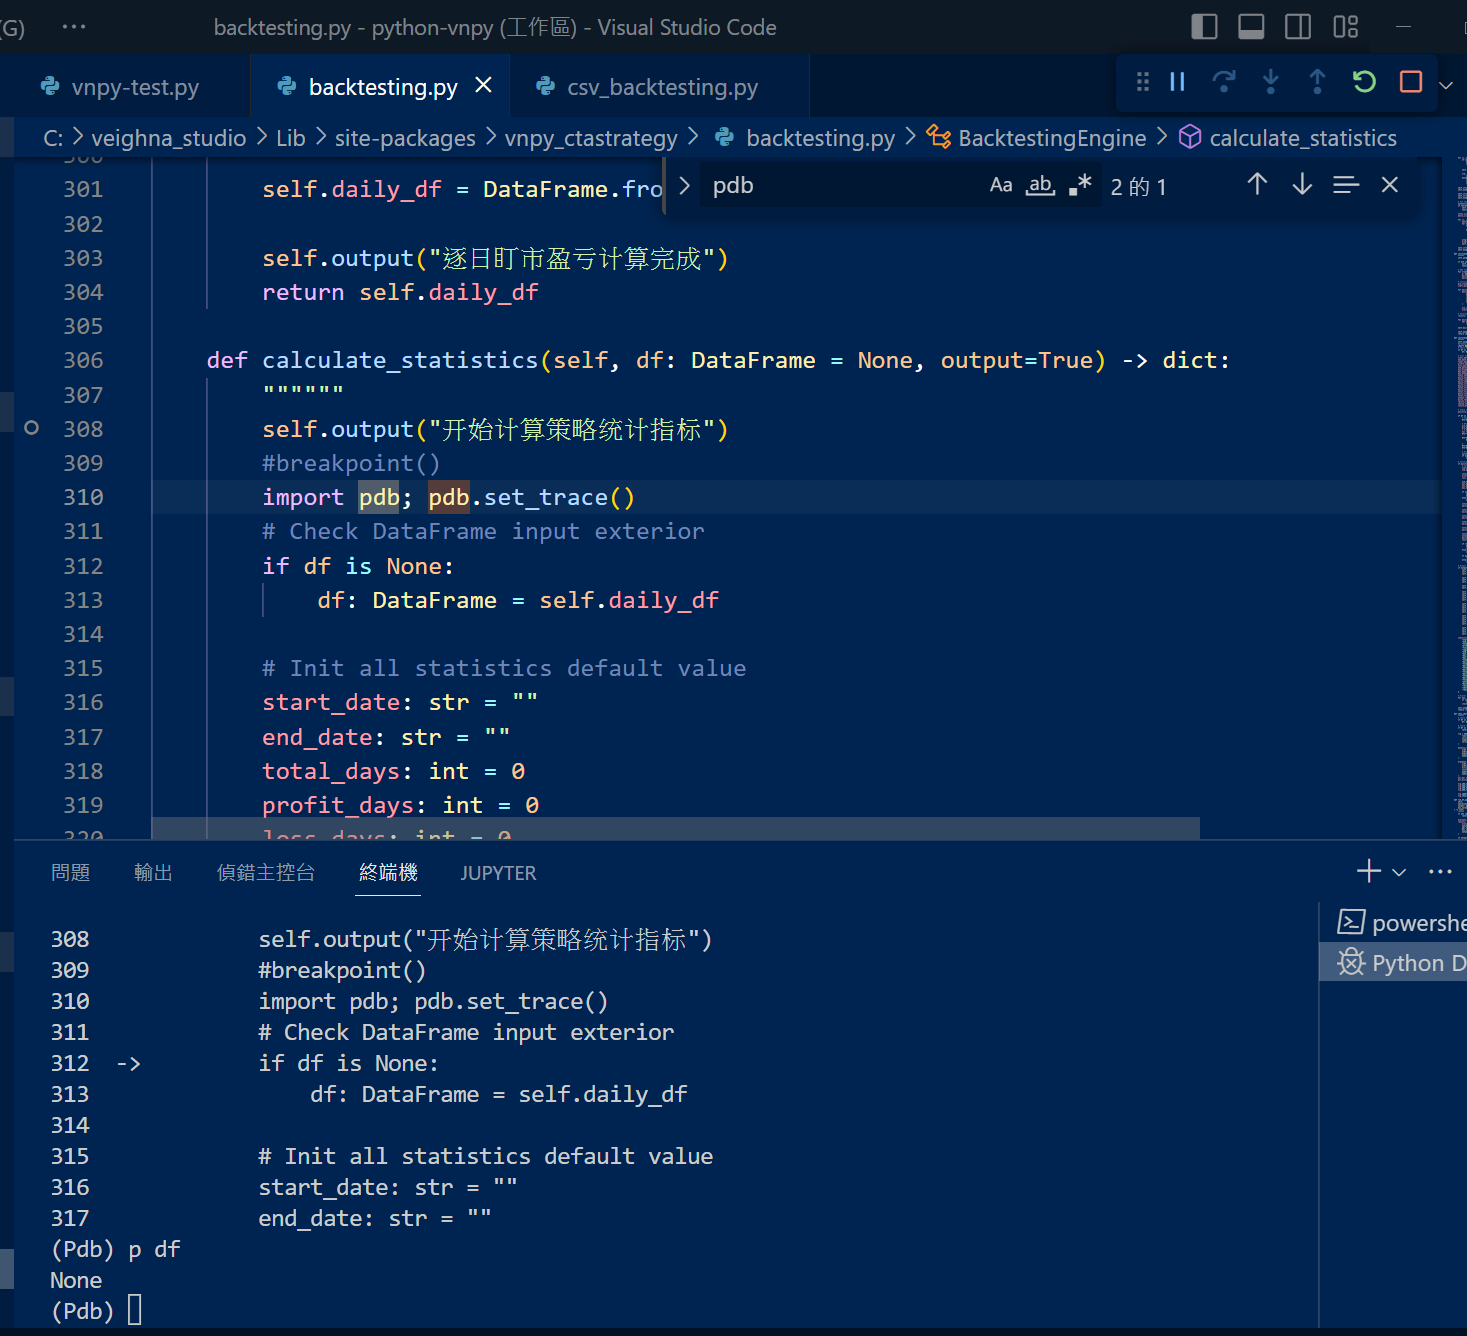
檢查由pd.read_csv所讀入之df, 看來正常..


進一步檢查self.history_data, 看來也正常..


還是找到了VS Code debug外部程式的關鍵: 真的是在justmycode=false後面加上purpose: ["debug-in-terminal"]就OK了


順利用VS Code trace入backtesting了..


找到出現怪異日期之處了: backtesting_data[0]


    def run_backtesting(self) -> None:
        """"""
        if self.mode == BacktestingMode.BAR:
            func = self.new_bar
        else:
            func = self.new_tick

        self.strategy.on_init()

        # Use the first [days] of history data for initializing strategy
        day_count: int = 0
        ix: int = 0

        for ix, data in enumerate(self.history_data):
            if self.datetime and data.datetime.day != self.datetime.day:
                day_count += 1
                if day_count >= self.days:
                    break

            self.datetime = data.datetime

            try:
                self.callback(data)
            except Exception:
                self.output("触发异常,回测终止")
                self.output(traceback.format_exc())
                return

        self.strategy.inited = True
        self.output("策略初始化完成")

        self.strategy.on_start()
        self.strategy.trading = True
        self.output("开始回放历史数据")

        # Use the rest of history data for running backtesting
        backtesting_data: list = self.history_data[ix:]
        if len(backtesting_data) <= 1:
            self.output("历史数据不足,回测终止")
            return

        total_size: int = len(backtesting_data)
        batch_size: int = max(int(total_size / 10), 1)

        for ix, i in enumerate(range(0, total_size, batch_size)):
            batch_data: list = backtesting_data[i: i + batch_size]
            for data in batch_data:
                try:
                    func(data)
                except Exception:
                    self.output("触发异常,回测终止")
                    self.output(traceback.format_exc())
                    return

            progress = min(ix / 10, 1)
            progress_bar: str = "=" * (ix + 1)
            self.output(f"回放进度:{progress_bar} [{progress:.0%}]")

        self.strategy.on_stop()
        self.output("历史数据回放结束")


backtesting中之calculate_statistics中的df有錯..


    def calculate_statistics(self, df: DataFrame = None, output=True) -> dict:
        """"""
        self.output("开始计算策略统计指标")
        #breakpoint()
        #import pdb; pdb.set_trace()
        # Check DataFrame input exterior
        if df is None:
            df: DataFrame = self.daily_df

        # Init all statistics default value
        start_date: str = ""
        end_date: str = ""
        total_days: int = 0
        profit_days: int = 0
        loss_days: int = 0
        end_balance: float = 0


self.daily_df.head(60)

            close_price  pre_close  ... total_pnl      net_pnl
date                                ...                       
2023-05-29        16567          1  ...  -13800.0  -14009.5170
2023-05-30        16588      16567  ... -153360.0 -156289.8774
2023-05-31        16416      16588  ...  258000.0  258000.0000
2023-06-01        16571      16416  ... -147180.0 -148432.2744
2023-06-02        16749      16571  ...   53400.0   53400.0000
2023-06-03        16762      16749  ...    3900.0    3900.0000
2023-06-05        16693      16762  ...  -53460.0  -54720.9252
2023-06-06        16798      16693  ...   31500.0   31500.0000
2023-06-07        16879      16798  ...   24300.0   24300.0000
2023-06-08        16814      16879  ...   27120.0   24583.9098
2023-06-09        16901      16814  ...   26100.0   26100.0000
2023-06-10        16930      16901  ...    8700.0    8700.0000
2023-06-12        17033      16930  ...   30900.0   30900.0000
2023-06-13        17249      17033  ...   64800.0   64800.0000
2023-06-14        17249      17249  ... -139140.0 -141719.8518
2023-06-15        17326      17249  ...  -53580.0  -54873.7464
2023-06-16        17244      17326  ...  -57000.0  -58290.2040
2023-06-17        17220      17244  ...   36000.0   36000.0000
2023-06-19        17235      17220  ...  -22500.0  -22500.0000
2023-06-20        17145      17235  ...  135000.0  135000.0000
2023-06-21        16937      17145  ... -118020.0 -120588.7926
2023-06-22        16919      16937  ...   27000.0   27000.0000
2023-06-26        16865      16919  ...   81000.0   81000.0000
2023-06-27        16790      16865  ...  112500.0  112500.0000
2023-06-28        16787      16790  ...  -86940.0  -88209.2412
2023-06-29        16749      16787  ...  136380.0  135111.1206
2023-06-30        16878      16749  ...  -62460.0  -63727.4808
2023-07-01        16865      16878  ...   -3900.0   -3900.0000
2023-07-03        17008      16865  ...   42900.0   42900.0000
2023-07-04        17105      17008  ...   29100.0   29100.0000
2023-07-05        16917      17105  ...   68700.0   67422.7290
2023-07-06        16549      16917  ...  552000.0  552000.0000
2023-07-07        16695      16549  ... -361920.0 -364434.3012
2023-07-08        16671      16695  ...  -19440.0  -20701.8972
2023-07-10        16660      16671  ...  -65400.0  -66657.7770
2023-07-11        16863      16660  ...   22740.0   21479.2152
2023-07-12        17034      16863  ...   51300.0   51300.0000
2023-07-13        17198      17034  ...  -84360.0  -86932.5348
2023-07-14        17289      17198  ...   27300.0   27300.0000
2023-07-15        17243      17289  ...  -13800.0  -13800.0000
2023-07-17        17287      17243  ...   13200.0   13200.0000
2023-07-18        17258      17287  ...  -29400.0  -30691.3110
2023-07-19        17094      17258  ...   68880.0   66297.8748
2023-07-20        16921      17094  ...  235200.0  233914.7910
2023-07-21        16926      16921  ...  -26940.0  -28214.7492
2023-07-22        16912      16926  ...   21000.0   21000.0000
2023-07-24        17070      16912  ...  -99300.0 -100577.6490
2023-07-25        17244      17070  ...   52200.0   52200.0000
2023-07-26        17128      17244  ...  -34980.0  -36264.9066
2023-07-27        17280      17128  ...  -42780.0  -44067.5634
2023-07-28        17375      17280  ...  -84360.0  -86940.7374
2023-07-29        17379      17375  ...    1200.0    1200.0000
2023-07-31        17113      17379  ...  224940.0  223646.7558
2023-08-01        17119      17113  ... -136260.0 -137548.2438
2023-05-17        15935      17119  ... -371400.0 -372213.1740
2023-05-18        16118      15935  ...  -51900.0  -52716.8640
2023-05-19        16092      16118  ...   -7800.0   -7800.0000
2023-05-20        16103      16092  ...    3300.0    3300.0000
2023-05-22        16124      16103  ...    6300.0    6300.0000
2023-05-23        16094      16124  ...  -41760.0  -42578.4012

[60 rows x 13 columns]


不錯的debug功能: 預覽呼叫階層(可以反查某函數被誰呼叫)


於csvbacktesting->load_data後的history_data, 資料是正確的..


即使進入了csvbacktesting->backtesting->run_backtesting時: self.history_data, 資料是正確的..


問題就在以下這段碼產生的backtesting_data有誤:

    def run_backtesting(self) -> None:
        """"""
        if self.mode == BacktestingMode.BAR:
            func = self.new_bar
        else:
            func = self.new_tick

        self.strategy.on_init()

        # Use the first [days] of history data for initializing strategy
        day_count: int = 0
        ix: int = 0

        for ix, data in enumerate(self.history_data):
            if self.datetime and data.datetime.day != self.datetime.day:
                day_count += 1
                if day_count >= self.days:
                    break

            self.datetime = data.datetime

            try:
                self.callback(data)
            except Exception:
                self.output("触发异常,回测终止")
                self.output(traceback.format_exc())
                return

        self.strategy.inited = True
        self.output("策略初始化完成")

        self.strategy.on_start()
        self.strategy.trading = True
        self.output("开始回放历史数据")

        # Use the rest of history data for running backtesting
        backtesting_data: list = self.history_data[ix:]
        if len(backtesting_data) <= 1:
            self.output("历史数据不足,回测终止")
            return

        total_size: int = len(backtesting_data)
        batch_size: int = max(int(total_size / 10), 1)

        for ix, i in enumerate(range(0, total_size, batch_size)):
            batch_data: list = backtesting_data[i: i + batch_size]
            for data in batch_data:
                try:
                    func(data)
                except Exception:
                    self.output("触发异常,回测终止")
                    self.output(traceback.format_exc())
                    return

            progress = min(ix / 10, 1)
            progress_bar: str = "=" * (ix + 1)
            self.output(f"回放进度:{progress_bar} [{progress:.0%}]")

        self.strategy.on_stop()
        self.output("历史数据回放结束")


使用debug visualizer插件:


找出ix值是關鍵..  ix用途?

        for ix, data in enumerate(self.history_data):
            if self.datetime and data.datetime.day != self.datetime.day:
                day_count += 1
                if day_count >= self.days:
                    break

            self.datetime = data.datetime


self.days=10與策略初始有關..


5. 日内对齐等交易时长K线生成器的实现

5.1 确定K线生成器MyBarGenerator的生成规则

5.1.1 一步到位地解决问题

先给它取个名称,就叫MyBarGenerator吧,它是对BarGenerator的扩展。
不过在构思MyBarGenerator的时候,我发现它其实不应该叫“日内对齐等交易时长K线生成器”。因为我们不应该只局限于日内的n分钟K线生成器,难道vnpy系统就不应该、不能够或者不使用日线以上的K线了吗?我们只能够使用日内K线进行量化交易吗?难道大家都没有过这方面的需求吗?我想答案是否定的。
那好,所幸就设计一个全功能的K线生成器:MyBarGenerator。
为此我们需要扩展Interval的定义,因为Interval是表示K线周期的常量,可是它的格局不够,最大只能到周一级WEEKLY。也就是说您用目前的Interval是没有办法表达月和年这样的周期的。

class Interval(Enum):
    """
    Interval of bar data.
    """
    MINUTE = "1m"
    HOUR = "1h"
    DAILY = "d"
    WEEKLY = "w"
    TICK = "tick"
    MONTHLY = "month"   # hxxjava add
    YEARLY = "year"     # hxxjava add

顺便在这里吐槽一下BarGenerator:

  • 目前的BarData中包含了一个interval字段的,可是它在BarGenerator的时候根本就没有使用过,而使用它本是信手拈来的事情,但是没有却没有使用。如果不信,你可以去看看用它产生出来的bar的内容。
  • 另外本来还应该增加一个秒单位(SECONDLY = "1s")的,这个单位其实对高频交易也是很有需求的,可是现在却没有。不知道大家对此有什么看法。

https://www.vnpy.com/forum/topic/30193-che-di-jie-jue-kxian-sheng-cheng-qi-de-wen-ti-yi-ge-ri-nei-dui-qi-deng-jiao-yi-shi-chang-de-kxian-sheng-cheng-qi


prog-0318

test test1 Written with StackEdit .